Brain tumor identification is a very tricky process which is usually done by invasive procedures such as a biopsy or via a blood test. With the boom in MRI imaging, doctors rely on manual interpretations from radiologists to accurately identify the tumor. There have been several softwares such as ITK SNAP or 3D slicer proposed to help radiologists identify tumors faster and more accurately. However, current manual approaches are still slow as compared to automatic brain tumor detection methods. Needless to say, even though applications have been developed to make manual segmentation a bit faster, the fact still remains that MRI images are still subject to intra and inter rater variability.
Intra rater reliability is used to determine how consistent an individual is at measuring tumors, while inter rater reliability describes how various individuals are at identifying the tumor region. There are several factors that may affect intra rater reliability such as time, experience and the condition of the person. Some practitioners require more time for identifying the tumor as it may help the examiner focus more and not rush through the anomalies.
In contrast, inter rater reliability is a metric used to determine the extent to which multiple examiners agree on the location of the tumor. The degree to which they will agree determines the reliability of the score. This metric allows us to impose level of objectivity, provides validation of evaluation results and increases confidence that examiners are following the proper guidelines in identifying a tumor.
Thesis statement
Brain MRI image interpretation is a laborious task for radiologists and doctors. The current approaches that are being widely used in hospitals include, purely manual interpretation and manual interpretation supported by digital image processing. In a purely manual process, doctors conduct visual interpretation on each single slice and circulate the slices among them. Visual interpretation is a tedious task, which is labor intensive and time consuming. A patient may miss the most suitable time for treatment because of delay in interpreting their brain images. An additional disadvantage of the purely manual interpretation is caused by subjectiveness. Limitation in human knowledge and experience often result in errors in brain image interpretation.
My research is aimed at developing a hybrid unsupervised image processing technique to detect tumors in brain MRI images automatically. It is a classification technique to classify high grade gliomas (HGG) and low grade gliomas (LGG) areas from normal areas, instead of a segmentation technique to segment an image into different unlabelled areas. The technique is designed to provide accurate tumor information in a timely manner. The technique does not require human involvement, therefore processing can be conducted automatically and efficiency can be significantly improved. This technique integrates the techniques of hierarchical density based spatial clusterings of applications with noises (HDBSCAN), which is a density based clustering algorithm and thresholding to overcome the limitations of individual techniques. Thresholding is the most basic way to segment images. This is usually done using a grayscale image to create binary images for objects of interest.
Objectives
- Devise a hybrid algorithm to differentiate between HGG and LGG tumors.
- Create a classification model to differentiate between tumors and normal brain scans.
- Produce insights on how normal brain differ from tumors.
- Design a method to achieve higher accuracy in a short period of time.
Dataset
There were two datasets utilized for this experiments. The BraTS 2018 dataset contains axial views of the brains in different modalities along with their ground truths. The Brain tumor public dataset contains normal images for comparison to tumor images
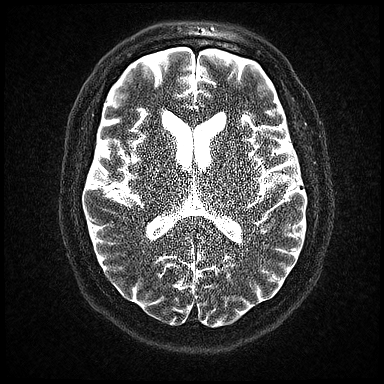
MRI Images
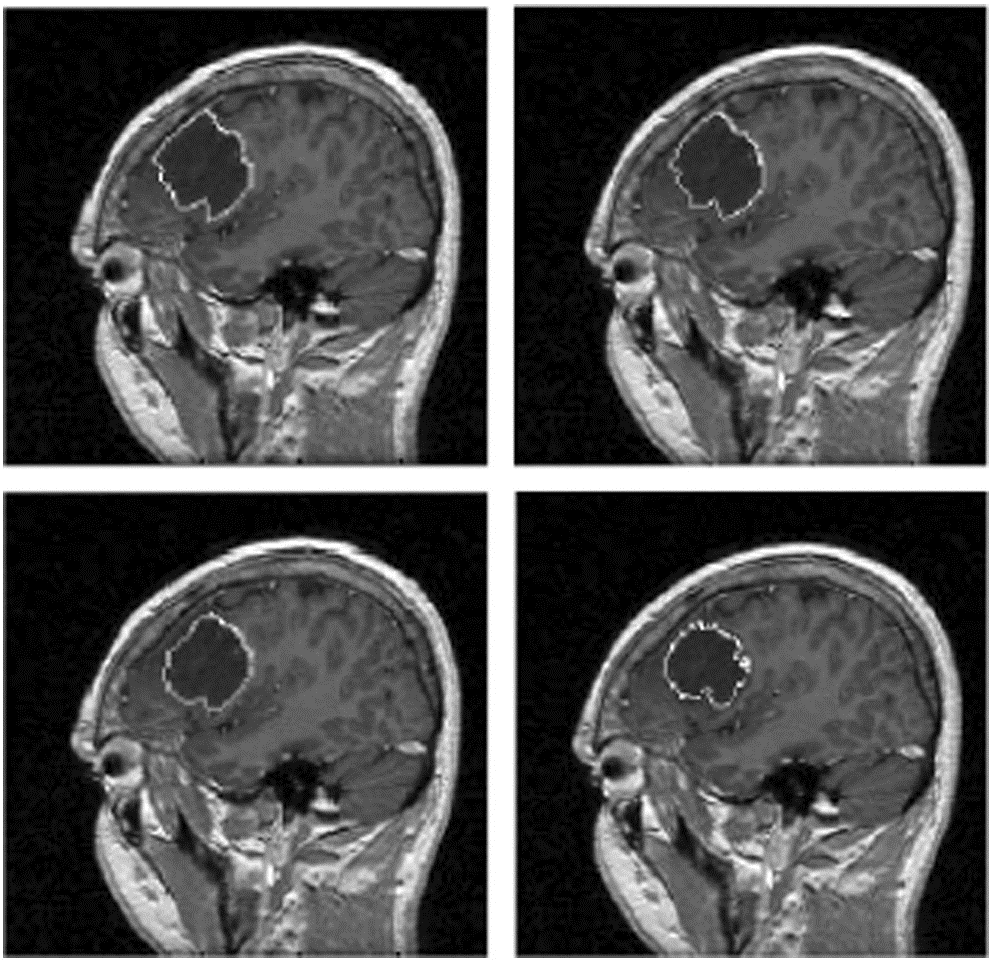
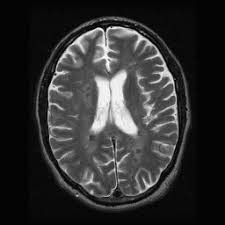
The first image shows a T2 slice and noise that is usually added after taking an MRI. The noise is not visible in FLAIR images due to contrast difference. The second image shows the inter rater reliability comparison between experts and novices. There are quite different opinions between where the tumor is located.
Libraries required
- Pandas - input data analysis and manipulation tool.
- NumPy - further data manipulation and conversion.
- Scikit-learn - contains machine learning models, feature extraction and metrics for evaluation.
- SimpleITK - contains various filters and helps in separating MRI slices for processing.
- Nibabel - required for reading MRI images which are NifTI files.
- HDBSCAN - is a hierarchical clustering algorithm that differentiates outliers from points of interest.
- Matplotlib - creating static graphs.
- Seaborn - drawing more creative graphs.
Method
- Preprocessing: To reduce image biases and noises, we apply an N4 bias filter and a smoothing/denoising filter.
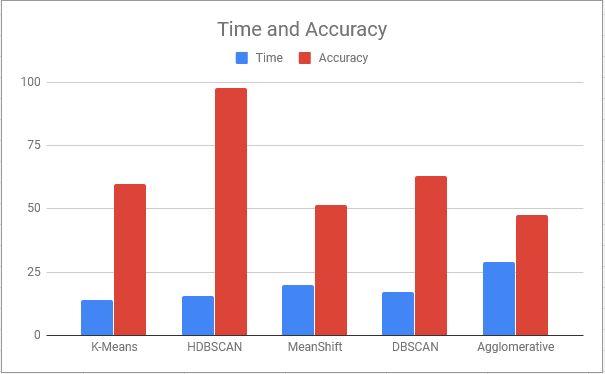
- Clustering: To cluster the MRI scan, we use one of the clustering algorithms such as HDBSCAN. Clustering algorithms such as K-Means, Meanshift, DBSCAN and Agglomerative clustering were used for comparison.
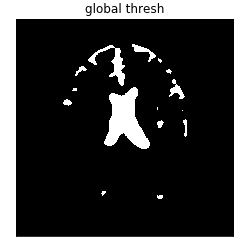
- Thresholding: The clustered image is passed into a thresholding filter to determine if the image contains a tumor.
- Evaluation and Analysis: After thresholding, the image is passed into several external and internal cluster metrics such as silhouette score, calinski harabasz score, precision, recall, accuracy and F1 score.
Results
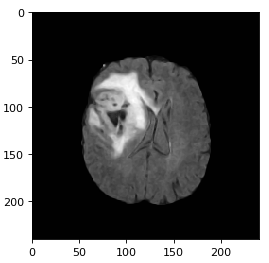
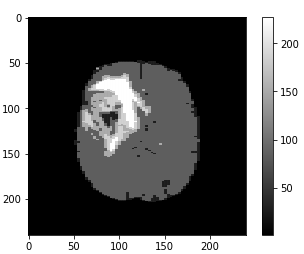
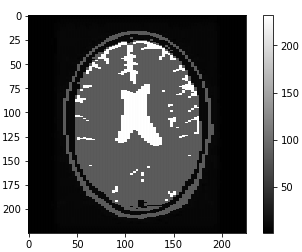
The first set of images shows a LGG going through filtering/denoising, HDBSCAN image reconstruction and thresholding. The same process is applied to the HGG (2nd set of images) and the normal brain image (3rd set of images).
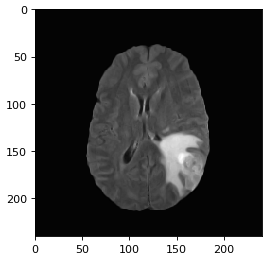
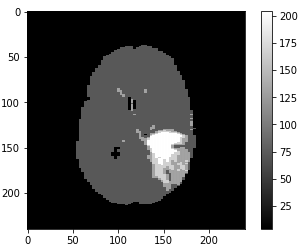
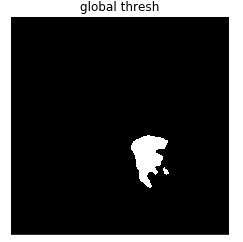
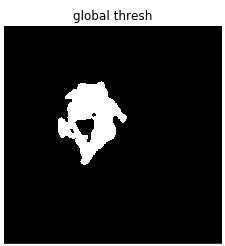
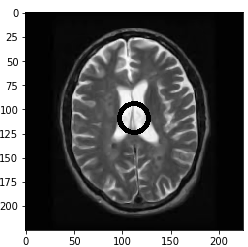
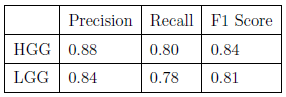
To avoid normal images being misclassified mainly due to ventricles a contour is set up to identify areas that have similar grey values to tumors. Final accuracy, time elapsed, precision, recall and F1 score are shown below. Since HDBSCAN can identify outliers with ease, it has a significant advantage over the rest of the algorithms.
For more information please refer to the Github.