Due to the COVID-19 pandemic, unemployment level is on the rise. However, even during these troubling times, the amount of fake job postings have also increased in Canada and in North America as a whole. This project aims to create a classification model to help users identify fraudulent job postings and provide valuable insights on how a fake job posting looks like.
Objectives
- Devise a method to combine all the useful columns.
- Create a classification model to differentiate between fraudulent and real jobs.
- Produce insights on how fake jobs differ from real job postings.
Dataset
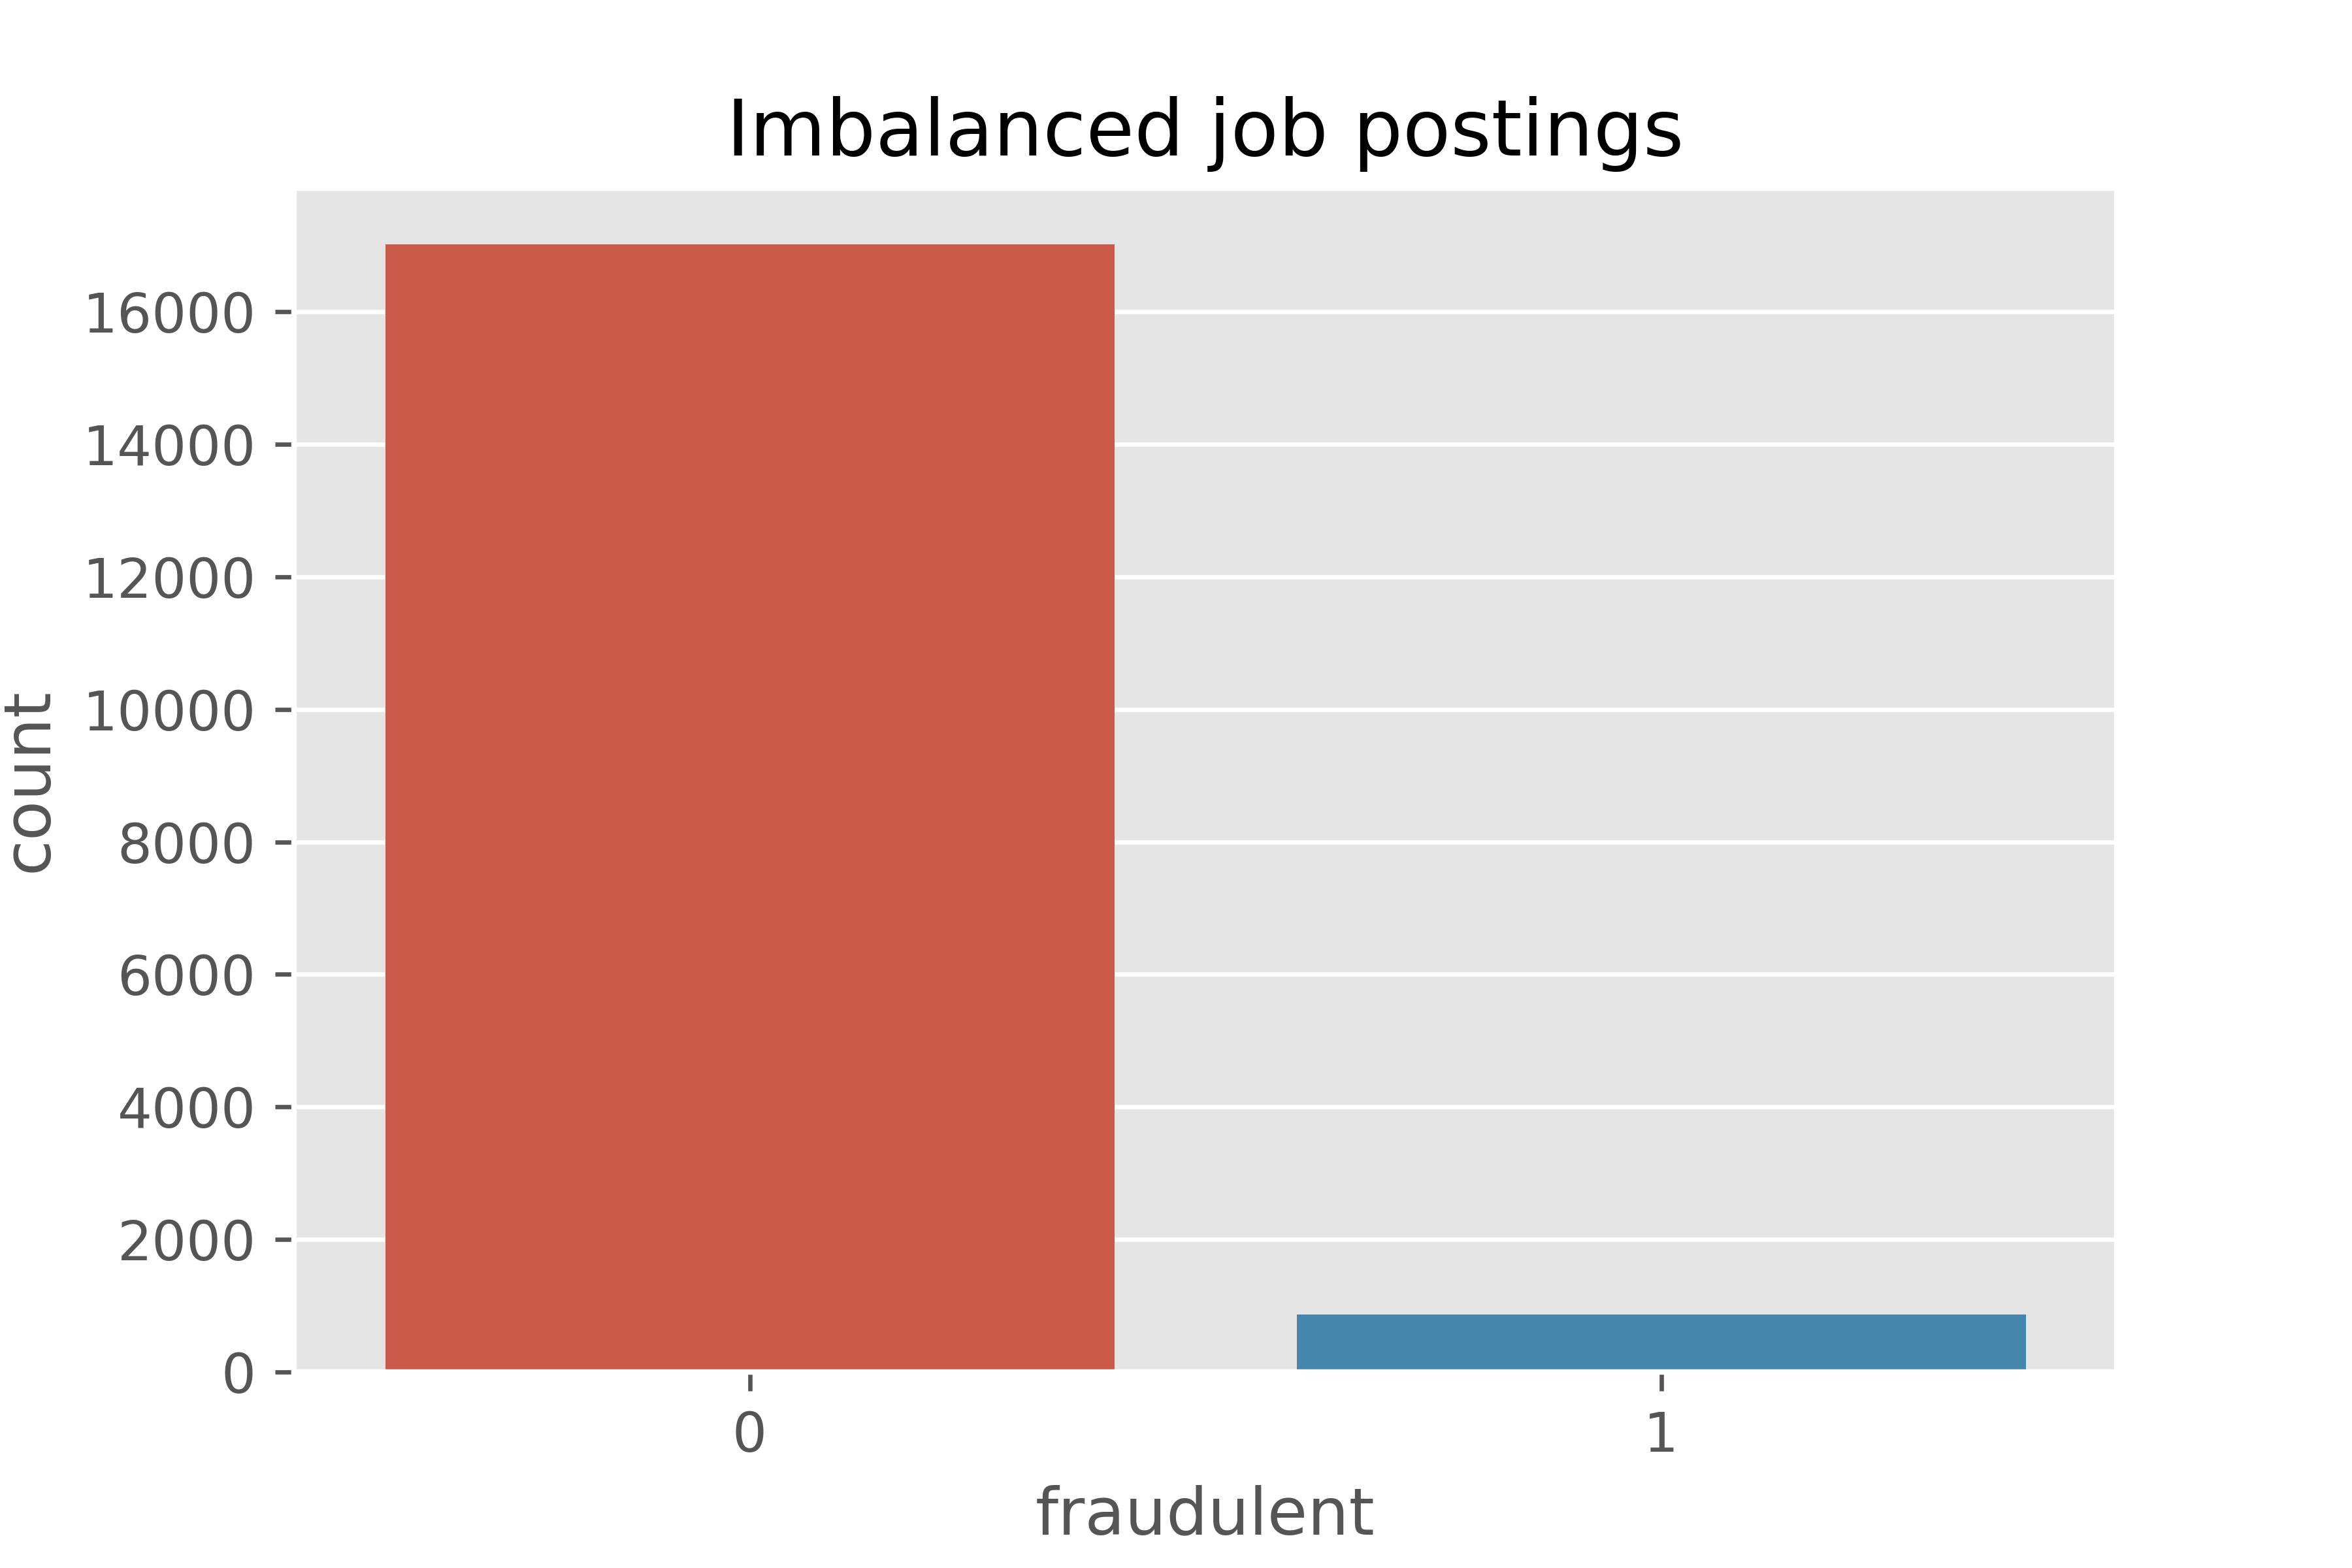
The dataset is available on Kaggle. It contains 18K job postings where 866 are fake job postings and 17014 are real job postings. 0 represents real job postings and 1 represents fake job postings.
Libraries
To make this project work we need:- Pandas - input data analysis and manipulation tool.
- NumPy - further data manipulation and conversion.
- Scikit-learn - contains machine learning models, feature extraction and metrics for evaulation.
- Nlppreprocess - removing stopwords, punctuation and more from the input data.
- Matplotlib - creating static graphs.
- Seaborn - drawing more creative graphs.
Method
Method can be divided into three stages:- Preprocessing: NaN values were replaced with blanks. Since we wanted to evaluate the different aspects of a job posting, a new column was created which consists of the title, location, company profile, description, requirements and benefits. Since it is an imbalanced dataset, undersampling was utilized for the majority class (real jobs) to balance out against the minority class (fake jobs). A train and test split was done on the texts to create training and testing sets.
- Since machine learning models can only process numerical data, we have to convert the input text. To do so Term frequency-inverse document frequency (TFIDF) vectorizer was utilized to create training and testing vectors. Countvectorizer was not used since it only counts the number of times a word appears in the document which will skew the results. While, TFIDF sees the overall document weightage of each word.
- Models: Multinomial Naive-Bayes, RandomForest, Logistic Regression and Support Vector machine were utilized to evaluate the set. F1 score was utilized to determine the efficiency of each model.
- Visualisation: Confusion matrix were made for each model to show how effectively did it classify. Graphs were made for required experience, function, industry, employment type, countries, and required education. NA was replaced for NaN values for better visualisation.
Please refer to the results folder on for insights and metrics utilized.
Graphs
You can zoom in on the graphs by hovering over them. Note: NA roles indicate NaN values where the person has not provided a role in the posting. Some of the graphs show:- Country wise job postings shows the top 11 countries where jobs have been posted. The most jobs have been posted in US, Great Britain and Greece.
- Fraudulence distribution based on employment type reveals the different employment types (Other, Full-time, NA, Part-time, Contract and Temporary) that were analyzed. Fraudulent jobs were found mainly for Full-time, NA and part-time roles.
- Jobs posted based on required experience underlines the required experience (Internship, Not Applicable, NA, Mid-Senior level, Associate, Entry level, Executive and Director) for jobs posted. Fraudulent jobs were mainly targeted for NA, Entry level and Mid-Senior level.
- Jobs posted based on function outlines jobs based on the job function. Most fraudulent jobs were under the function NA, Administrative and Engineering.
- Jobs posted based on industry showcases industries with real and fraudulent job postings. Fraudulent jobs were mostly listed for industries like NA, Oil & Energy and Hospital & Health Care.
- Jobs posted based on required education highlights the required education needed for jobs. Fraudulent jobs usually required NA, high school or equivalent and bachelors degree.
- Imbalanced job postings emphasizes that the dataset is highly imbalanced. There are more real job postings as compared to fake jobs.


Improvements
This project can be improved in several ways, in terms of data preprocessing, data visualisation and models.- Data Preprocessing: Gensim, SpaCy or NLTK can be utilized for stopword removal as well as stemming or lemmatizing. To deal with imbalanced datasets, data augmentation techniques can be used. Rather than performing data augmentation, libraries such as Imbalanced-learn allows to undersample, oversample, SMOTE and other techniques to deal with imbalanced datasets instead. Other methods can be used to convert text data into vectors such as Word2vec, Bag of words or Co-occurrence vector.
- Models: Machine learning models can be finetuned more using rfgridsearch or through trial and error. Other models like LSTM could have been utilized.
- Data Visualisation: Libraries like Plotly or Bokeh can be used to make interactive plots.
For more information please refer to the Github.